Annual report poster 2017
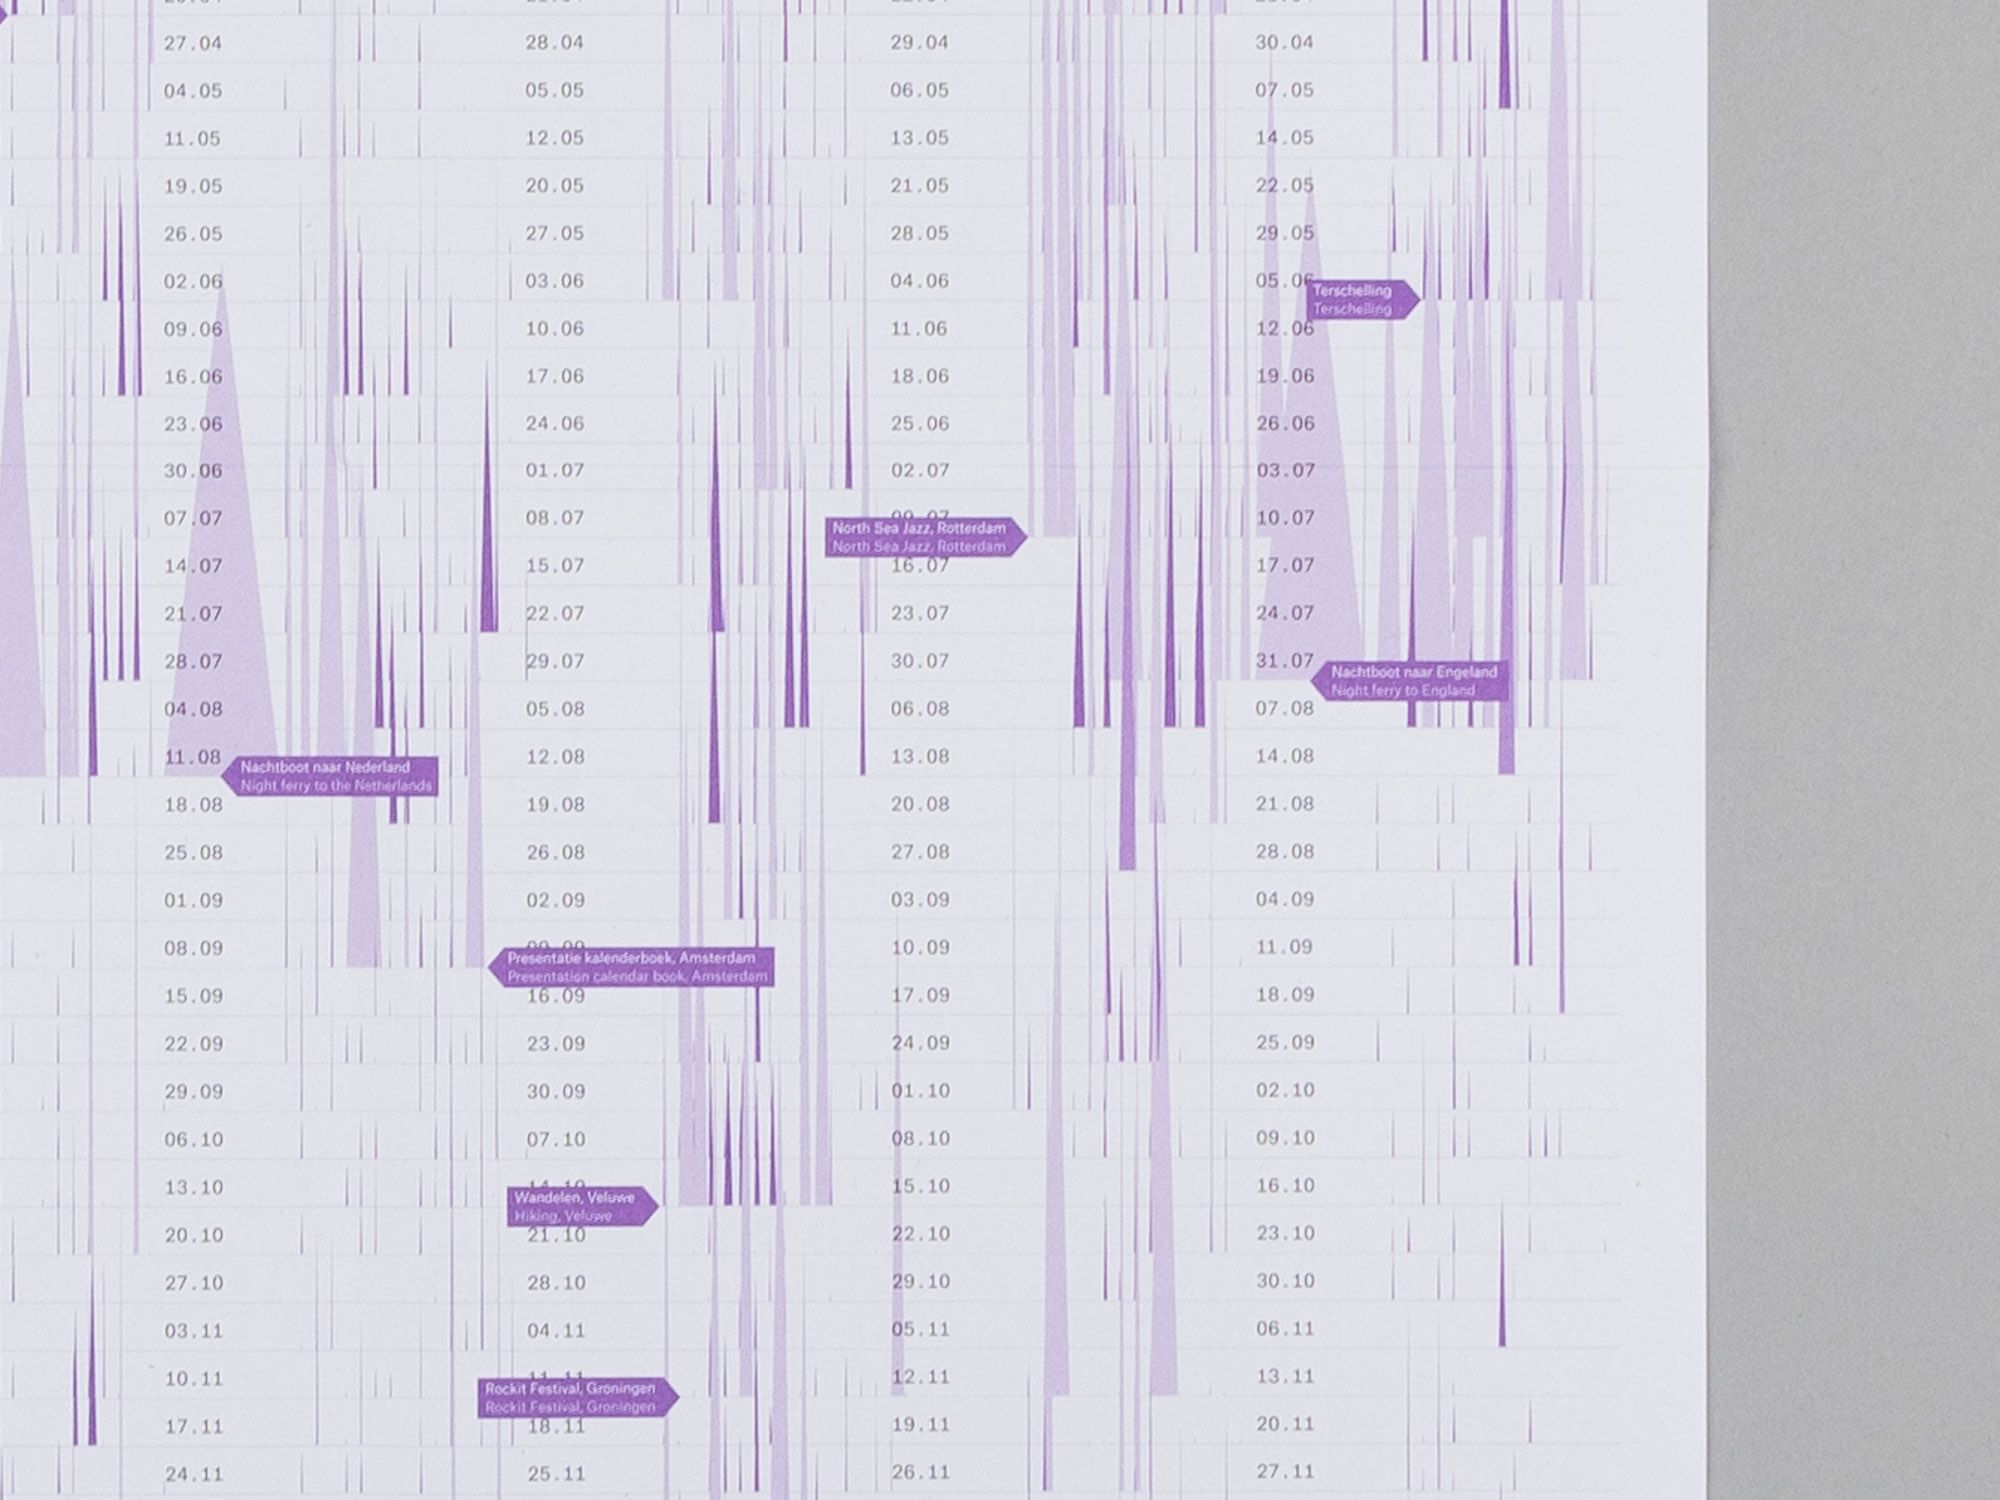
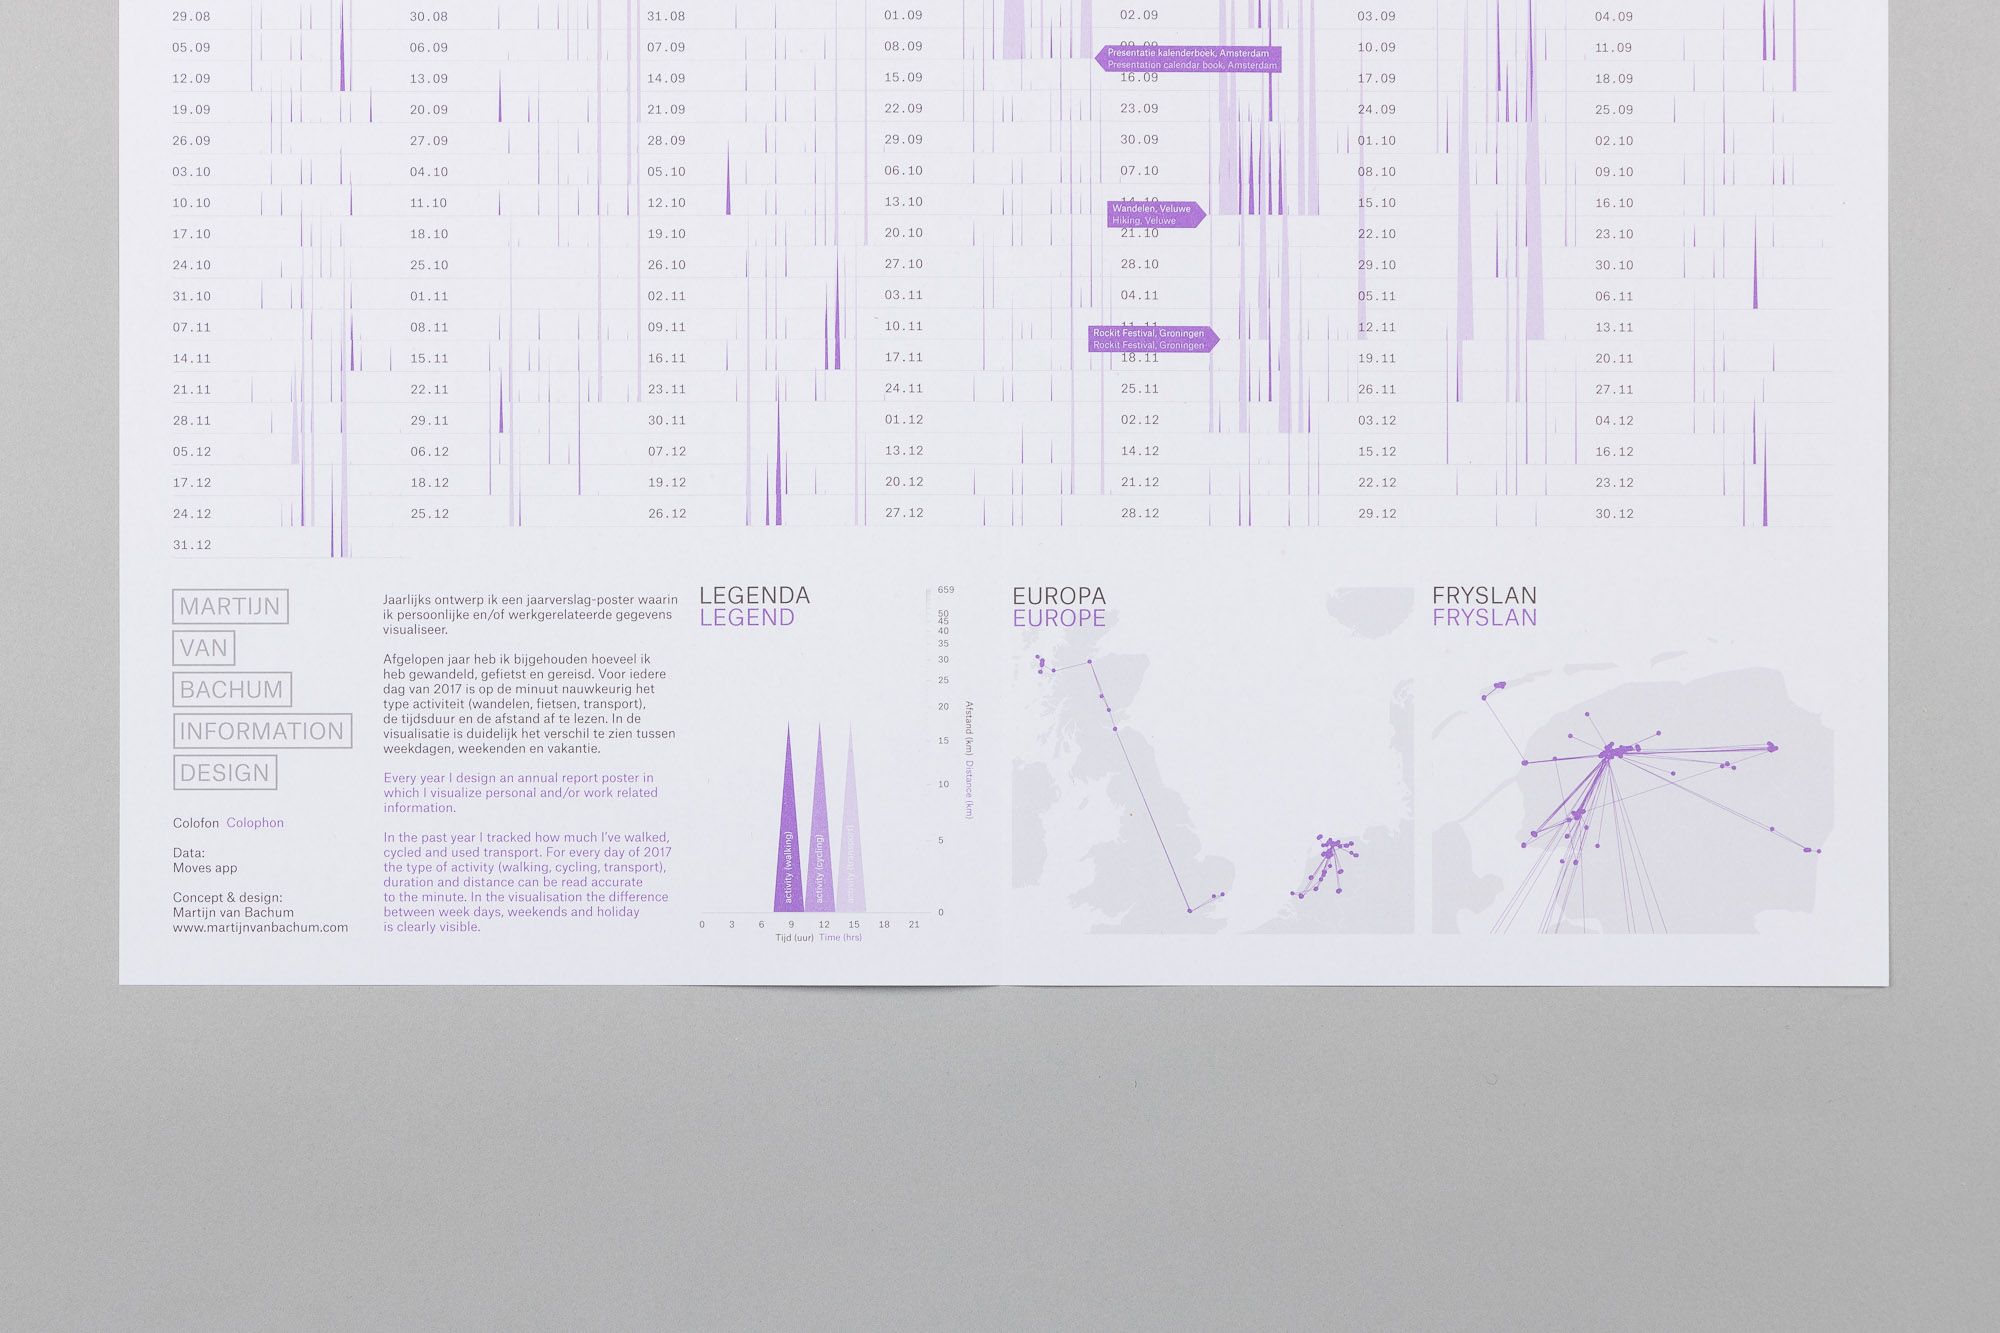
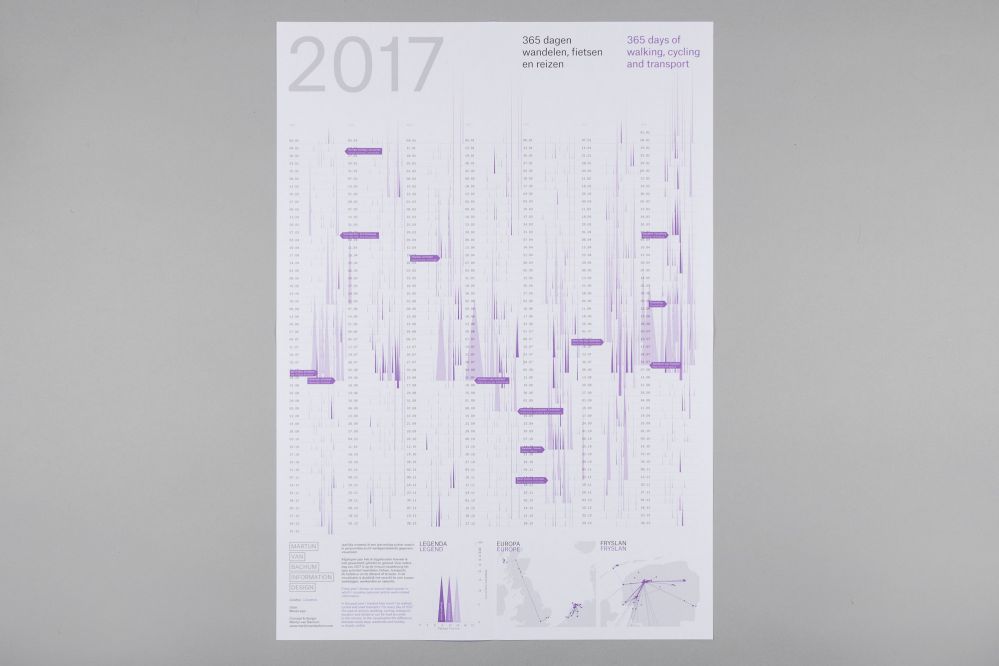
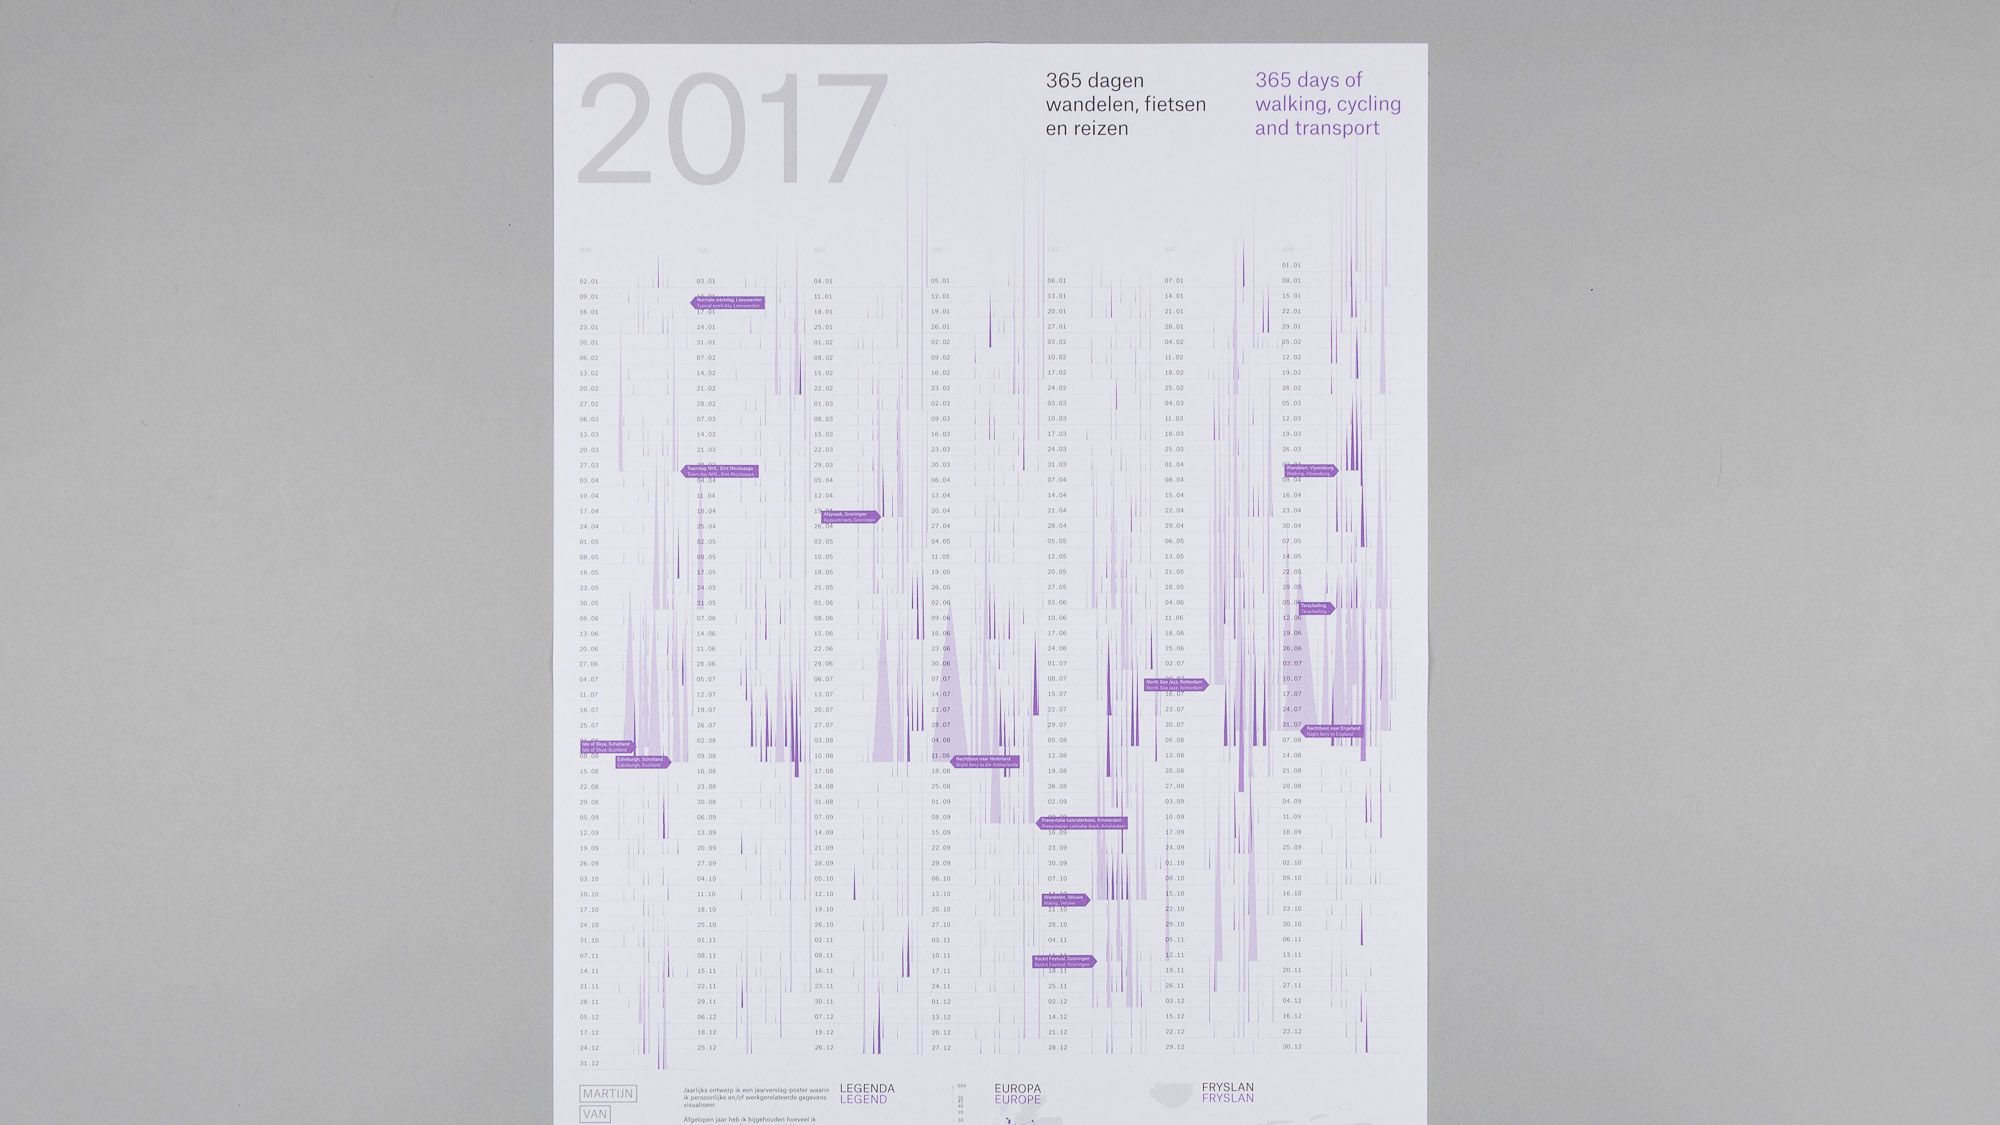
In 2017 year I tracked how much I walked, cycled and used transport. For every day of this year the type of activity, duration and distance can be read accurately to the minute. In the visualisation the difference between workdays, weekends and holidays is clearly visible.
- Client
- Self initiated
- Year
- 2017
- Services
- print / data visualization / subjective data / creative coding / graphic design